
Which of the graphs shown below would best represent the change in conductance $(G_{sol})$ when a solution containing $0.1 \, M$ each of $HCl$ and $HCN$ is titrated with $0.1 \, M$ $NaOH$ solution?
- A
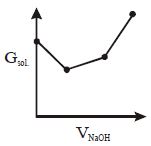
- B
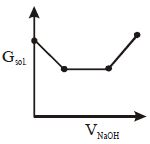
- C
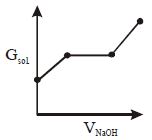
- D
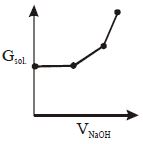
Explore More
Similar Questions
In an acid-base titration,$0.1 \ M \ HCl$ solution was added to the $NaOH$ solution of unknown strength. Which of the following correctly shows the change of $pH$ of the titration mixture in this experiment?
Why are strong acids generally used as standard solutions in acid-base titrations?
Easy
View SolutionAn organic dye,eosin,used to detect the endpoint of precipitation titration by adsorption is called:
Medium
View SolutionTemporary hardness in tap water is measured in terms of parts of $CaCO_3$ per $10^6$ parts of water. If $500 \ mL$ of hard water containing $Ca(HCO_3)_2$ was titrated against $\frac{1}{20} \ M \ H_2SO_4$ solution in the presence of a methyl orange indicator,and it required $40 \ mL$ of titrant,then the temporary hardness in the tap water is .............. $ppm$.
Difficult
View SolutionCan titrations with $KMnO_4$ be performed in the presence of $HCl$? Why?
Easy
View SolutionVedclass Products
For Students
Vedclass Test Series
Mock tests in real JEE/NEET style with performance analysis. 5-day free trial.
Start Free TrialFor Teachers
Exam Paper Generator
Generate Set A/B/C/D exam papers from 7.5L+ questions in 2 minutes. 3 chapters free.
Try FreeFor Institutes
Online Exam Module
Live online exams with unlimited students, 360° analytics & white-label branding.
See Demo